

That it was particularly warm in August will not be news to many people. But exactly how hot did it get in the Dutch inner cities? This sixth episode focuses on the figures from Zwolle, Haarlem and Breda. As usual, the data from the Ecostress satellite are projected onto a city map to find out which places city dwellers should steer clear of and where, in contrast, cooler conditions can be found under the sweltering summer sun.

The ground surface temperature is calculated for this measurement. This reading generally behaves more extreme than air temperature, which we are familiar with from weather maps. The data of 12 and 13 August were used in this series.
Why specifically these days? Because, from a data-technical point of view, the Netherlands was in luck. The satellite happened to fly over our country that weekend in the afternoon, when the Royal Netherlands Meteorological Institute (KNMI) mercury rose above 30 °C almost everywhere, without a cloud in the sky. In fact, overcast weather conditions make this measurement unreliable by definition.

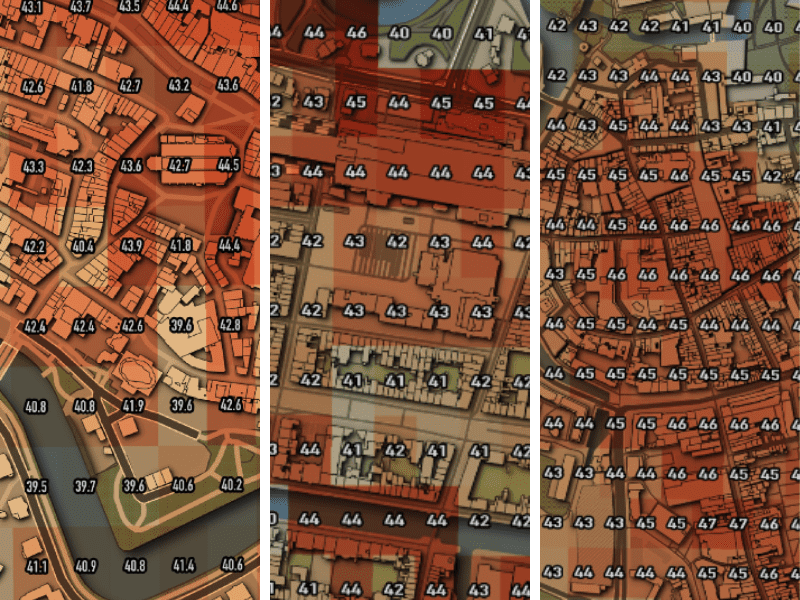
Zwolle
Will this former Hanseatic city manage to cope with the heat of the 21st century as well as it did with unwelcome visitors in the 17th century? In any event, it is already clear from the orange hues that there are no real high heat peaks or particularly refreshing areas here. Ground temperatures ranged anywhere from 39°C to 47 °C here on 12 Aug. These are naturally fairly sizeable differences, but not the sixteen degrees that appear in another city later in this article.
Although the Nieuwstraat did get a little warmer than the rest. For the highest readings in Zwolle, we have to visit the surrounding residential neighborhoods. These pre-war residential neighborhoods are up a degree or two above the inner city averages. Especially in the side streets of the Van Karnebeekstraat in the Assendorp neighborhood and around the Schoolstraat-Berkumstraat in Diezerpoort area, the temperatures soar to almost 47°C.
Heat-haters would do well to seek refuge in Park Eekhout and the sprawling Wezenlanden Park. But across the board – very average scores for a very average Dutch city.

Haarlem
The second city in this episode would seem to be the opposite of Zwolle. In Haarlem, by contrast, ground temperatures tend to jump in all directions. Around the train station, for example, this is evident with readings in the immediate area rising closer to 47 °C, while just a few streets away it lingers at around 40 °C. On the southern side of the inner city, the picture is more unequivocal: hot, very hot.
Because although Haarlem is a stone’s throw away from the North Sea, the side streets of the Gedempte Oude Gracht prove to be quite a heat magnet. Like an oil slick, the 45°C+ zone stretches across the cobblestones of its monumental shopping heart. Whereas on the other side of the canal in the vicinity of Molen de Adriaan, which dates back to 1779, the level of heat stress is not so bad.
If we zoom out a little further, differences between residential neighborhoods also become more apparent. The Koninginnenbuurt and the Potgieterbuurt (buurt is Dutch for neighborhood) are significantly warmer than the Spaarnwouderbuurt and the Slachthuisbuurt. The very highest ground surface temperatures are found in the industrial terrain areas of the Waarder and Veenpolder, where, according to the NASA algorithm, it reached 48.4°C on the ground at Tappersweg. Nevertheless, this still lags behind the heat peaks that occurred in the last city of this episode.

Breda
In the second-largest city in the province of Brabant, the temperature north of the railway station was so high on 13 August that the entire color palette of this map was thrown out of balance. The biggest impact came from the furniture boulevard cum business park Spinveld, where 54.4°C was measured in one spot between the warehouses that house a number of car companies, hardware stores and gyms. Sportspeople who crave a relaxing sauna after their workout need only to walk outside here and wait for 15 minutes. A similar situation is seen further north, where on the asphalt of De Krochten, at 53.3°C, it also got blisteringly hot.
Thanks to these deep red patches, the figures elsewhere in the city tend to fade in comparison. After all, even in the inner city of Breda, it is hot and sweaty in some places, with the warmest spots in the Van Ginnekenstraat and around Leuvenaarstraat. Shade in Breda – as is the case in many cities – can be found in the city parks, which the city has quite a few of in the immediate vicinity. An important distinction in the case of Breda is that, at 33.2 °C, it was about two degrees warmer here, according to KNMI. This makes it fair to say that Haarlem’s inner city has the worst heat islands in this episode.
How are the other residential neighborhoods of Breda faring? The neighborhoods west of the center warm up a little more than the rest. Still, the most notable fact here is that difference between the Valkenberg Park on the waterfront and the hottest spot in Spinveld is a staggering sixteen degrees. Such large differences have not been seen in this column so far.

De Krochten (hot as hell)?
Although Zwolle never came anywhere near the top ten in this column, the heat peaks of Breda ensured that Haarlem fell just short of the list. With De Krochten in third place and Spinveld in second, the Brabanders have two exceptionally warm hot spots. It was only on the roof of the Jaarbeurs in Utrecht that things got slightly hotter than they did here.
The next episode featuring another three new cities will be published on Innovation Origins this Friday.
Related Posts


 winners of the Gerard and Anton Awards")


