

The month of August once again seems to be dominated by the coronavirus in Europe. The lung virus, which by now has infected more people than the entire population of the Netherlands, is still raging around the world at full speed. Our continent has been relatively quiet for two months, but this seems to have come to a definite end with the recent increases in most countries.
Two weeks ago, new purple peaks were visible on the map in some areas. Last week the start of the second wave was unmistakable and now the pandemic is definitely back. The recent summer surge started in Belgium and Spain, but now the figures are also rising towards alarming levels in many other countries.

The end of July: No heat, but a corona wave
Last week, compared to a week earlier, the increases were most significant in Western Europe. Belgium, in particular, seems to be taking another hit. The outbreak in the province of Antwerp increased by 83 per 100,000 (1,543 diagnoses), making it the seventh highest weekly increase.
The rest of Belgium is also considerably darker than last week. This “stain” transcends national borders. This can be clearly seen, for example, in the province of South Holland. Here, the number of infections increased by 925, which amounts to an increase of 24.5 per 100,000 inhabitants in seven days. This is equivalent to a 35th position in the list of more than 300 parts of Europe. In Benelux, South Holland is number three on the worrying list after Antwerp and Luxembourg. This unwanted summer trend is also visible in neighboring French and German regions.
The Netherlands, however, shows a very different type of distribution than Belgium. Whereas our southern neighbors show growth throughout the country, this is not the case in the Netherlands. The country seems to be divided into a wild west and an orderly east. In fact, Drenthe and Friesland are among the areas with the fewest new infections of the entire continent. With less than 10 new positive diagnoses in the past week, these two northern provinces at places 18 and 22 are on the “good” side of the list.
Spain currently has the greatest cause for concern. Cases in the northeast of the country are rising at an unprecedented rate, with Aragon as the outlier. Although this autonomous region is not much larger than Utrecht or Overijssel in terms of population, the number of infections increased by no less than 2,913. This amounts to an astronomical 220.8 per 100,000 inhabitants. Such a high weekly increase has not been observed in Europe since the start of this series at the beginning of May. The Basque country, Catalonia and Navarre are also among the regions where the fire of the second wave is most intense.
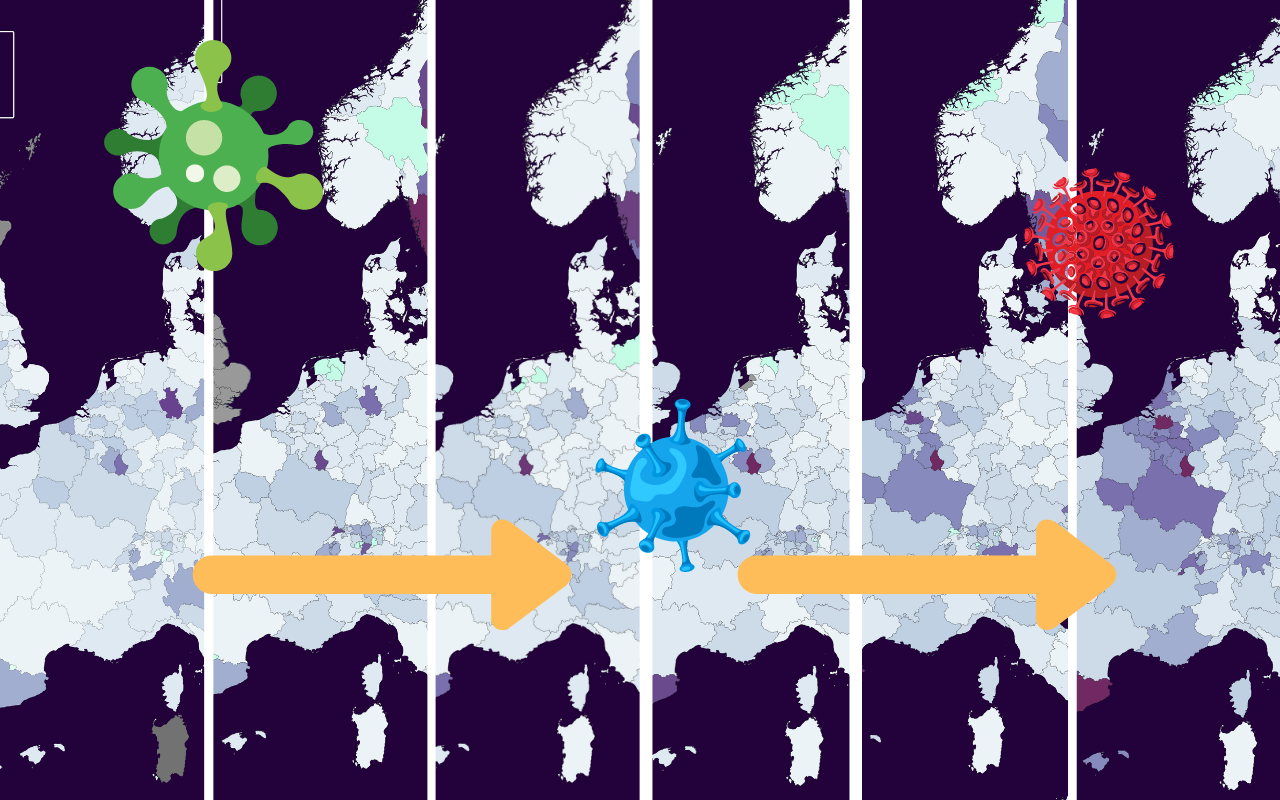
How did this happen? The slider below compares the weekly map of a month ago with last week’s map. The second slider shows the difference between last week and the first full week of July.
[twenty20 img1=”236272″ img2=”236271″ direction=”horizontal” offset=”0.5″ align=”none” width=”100%” before=”Before” after=”After” hover=”false”]
[twenty20 img1=”233725″ img2=”236273″ direction=”horizontal” offset=”0.5″ align=”none” width=”100%” before=”Before” after=”After” hover=”false”]
The dark cloud called coronavirus
The sliders mainly show how the virus has found its way back to Europe. In the Balkan countries, things have been moving fast since the end of June, but this turned out to be only the harbinger for more. In Romania it got out of hand in a month. Lisbon and Luxembourg were also very “early” during this peak. The odd man out on these maps is quirky Sweden that shows a declining trend after it dominated the lists for months on end.
Yet it is not impacting everywhere. Slovakia, Greece and Hungary, which came through spring mostly intact, also show modest growth figures. But here, too, more coronavirus cases were observed than in June. Also in Norway, Germany, Finland, Ireland, the Baltic States and Italy, which was so badly affected in March, there seems to be little reason for great concern this summer.
Curious about the situation in another region? The database used to create these maps can be viewed via Google Drive.
It is rather difficult to predict the impact of coronavirus flare-ups on mortality and hospital admissions since no comparable scenario is available. Because more tests are being carried out on the entire continent, it can be assumed that the pandemic will become visible more quickly in figures. On the other hand, it is not known exactly how many people had the coronavirus in February and March.
An increase in hospitalizations and deaths is not yet reflected in the data. But this is not surprising, either, since there can be a delay of up to four weeks. Nothing visible is happening, as can be seen on the map of Our World in Data which tracks the number of positive test results. Despite the larger test capacity of many countries, increases can also be seen here.
Belgium, the Czech Republic and Spain in particular stand out here, but also in the Netherlands the share of positive coronavirus tests rose from 0.5% to 1% in the past three weeks.
Exponential unpredictability
Europe still scores below the WHO’s critical threshold in most countries. They state that there is enough testing in a country if less than 10 percent is positive, which means we are doing very well in Europe. Some countries are above the signal value of 3%, but in terms of testing capacity it is generally negligible. Nevertheless, this spring’s biggest surprise was the exponential quality of the pandemic.
The treacherous thing about exponential growth is that for a long time it doesn’t seem to be high, and then within a few days it almost overloads the ICU capacity of a country. Will that happen with the current increase in exponential growth? That would seem to be the case if you look at a number of European countries on a logarithmic basis.
This is similar if you compare a number of European countries on a logarithmic scale with the increases between 1 July and 2 August with the same dataset of World in Data.
For the purpose of context, Brazil and the U.S. have been added, where there has never really been a summer break in coronavirus cases. If a line on a logarithmic scale makes an angle of 45 degrees, there is an exponential increase.
Flattening the curve (again)
On the basis of advancing milestones over seven days, the Netherlands is rising even faster than the ”corona leaders” Spain and Belgium. Is this increase entirely attributable to the scaling up of the GGD’s testing capacity, or is this a worrying development after all? This constitutes part of it at least, but how big this is remains a guess.
However, if this trend is not stopped, the burden of care and the number of deaths will in any case increase in August. COVID-19 has a mortality rate that is probably much lower than 1 percent. This is both a curse and a blessing. After all, half a percent of a million people still means 5,000 deaths. This law of large numbers is sometimes overlooked.
How can a new scenario like we saw this spring be prevented? The biggest influence factor is the behavior of the population. A government can impose all kinds of restrictions, but if virus-weary inhabitants hand out group hugs to each other en masse on the Malieveld field in The Hague or in front of the Brandenburg Gate in Berlin, the coronavirus will in theory get the chance to cause a very macabre late summer with every contact. Since a virus needs human contact to spread, a social chain is only as strong as its weakest link.
There’s another significant threat reminiscent of spring. This month, many people are returning from their “well-deserved” summer vacation abroad. Does this feel like déjà-vu? That could be right. After all, in February many holidaymakers returned from their well-deserved winter ski vacation, bringing the virus home with them.


