

Over the past few months, corona maps have been raining down on all kinds of media. These basically come in two types: a map with comparisons between different countries, or a zoomed-in version of one country depicting provinces or municipalities. This week I’ve been busy putting together and designing a new type of map; let’s call it a hybrid. Given that the month of April is over and the whole of Europe is affected by the epidemic, I thought it would be very interesting to map that month on a subnational level across more than twenty countries. Why subnationally? Because differences between regions vary greatly from country to country. Sicily has vastly different figures compared to Lombardy and the Dutch province of North Brabant reveals a completely different story to that of Groningen.
Which region has the most COVID-19 diagnoses? Where is the mortality rate at its lowest? And which province in April had the highest mortality rates in relation to diagnoses? These maps provide answers to such questions. Prefer to view them in full resolution? Then click on the image of the map for a hi-res version.
Diagnosis density levels April 1
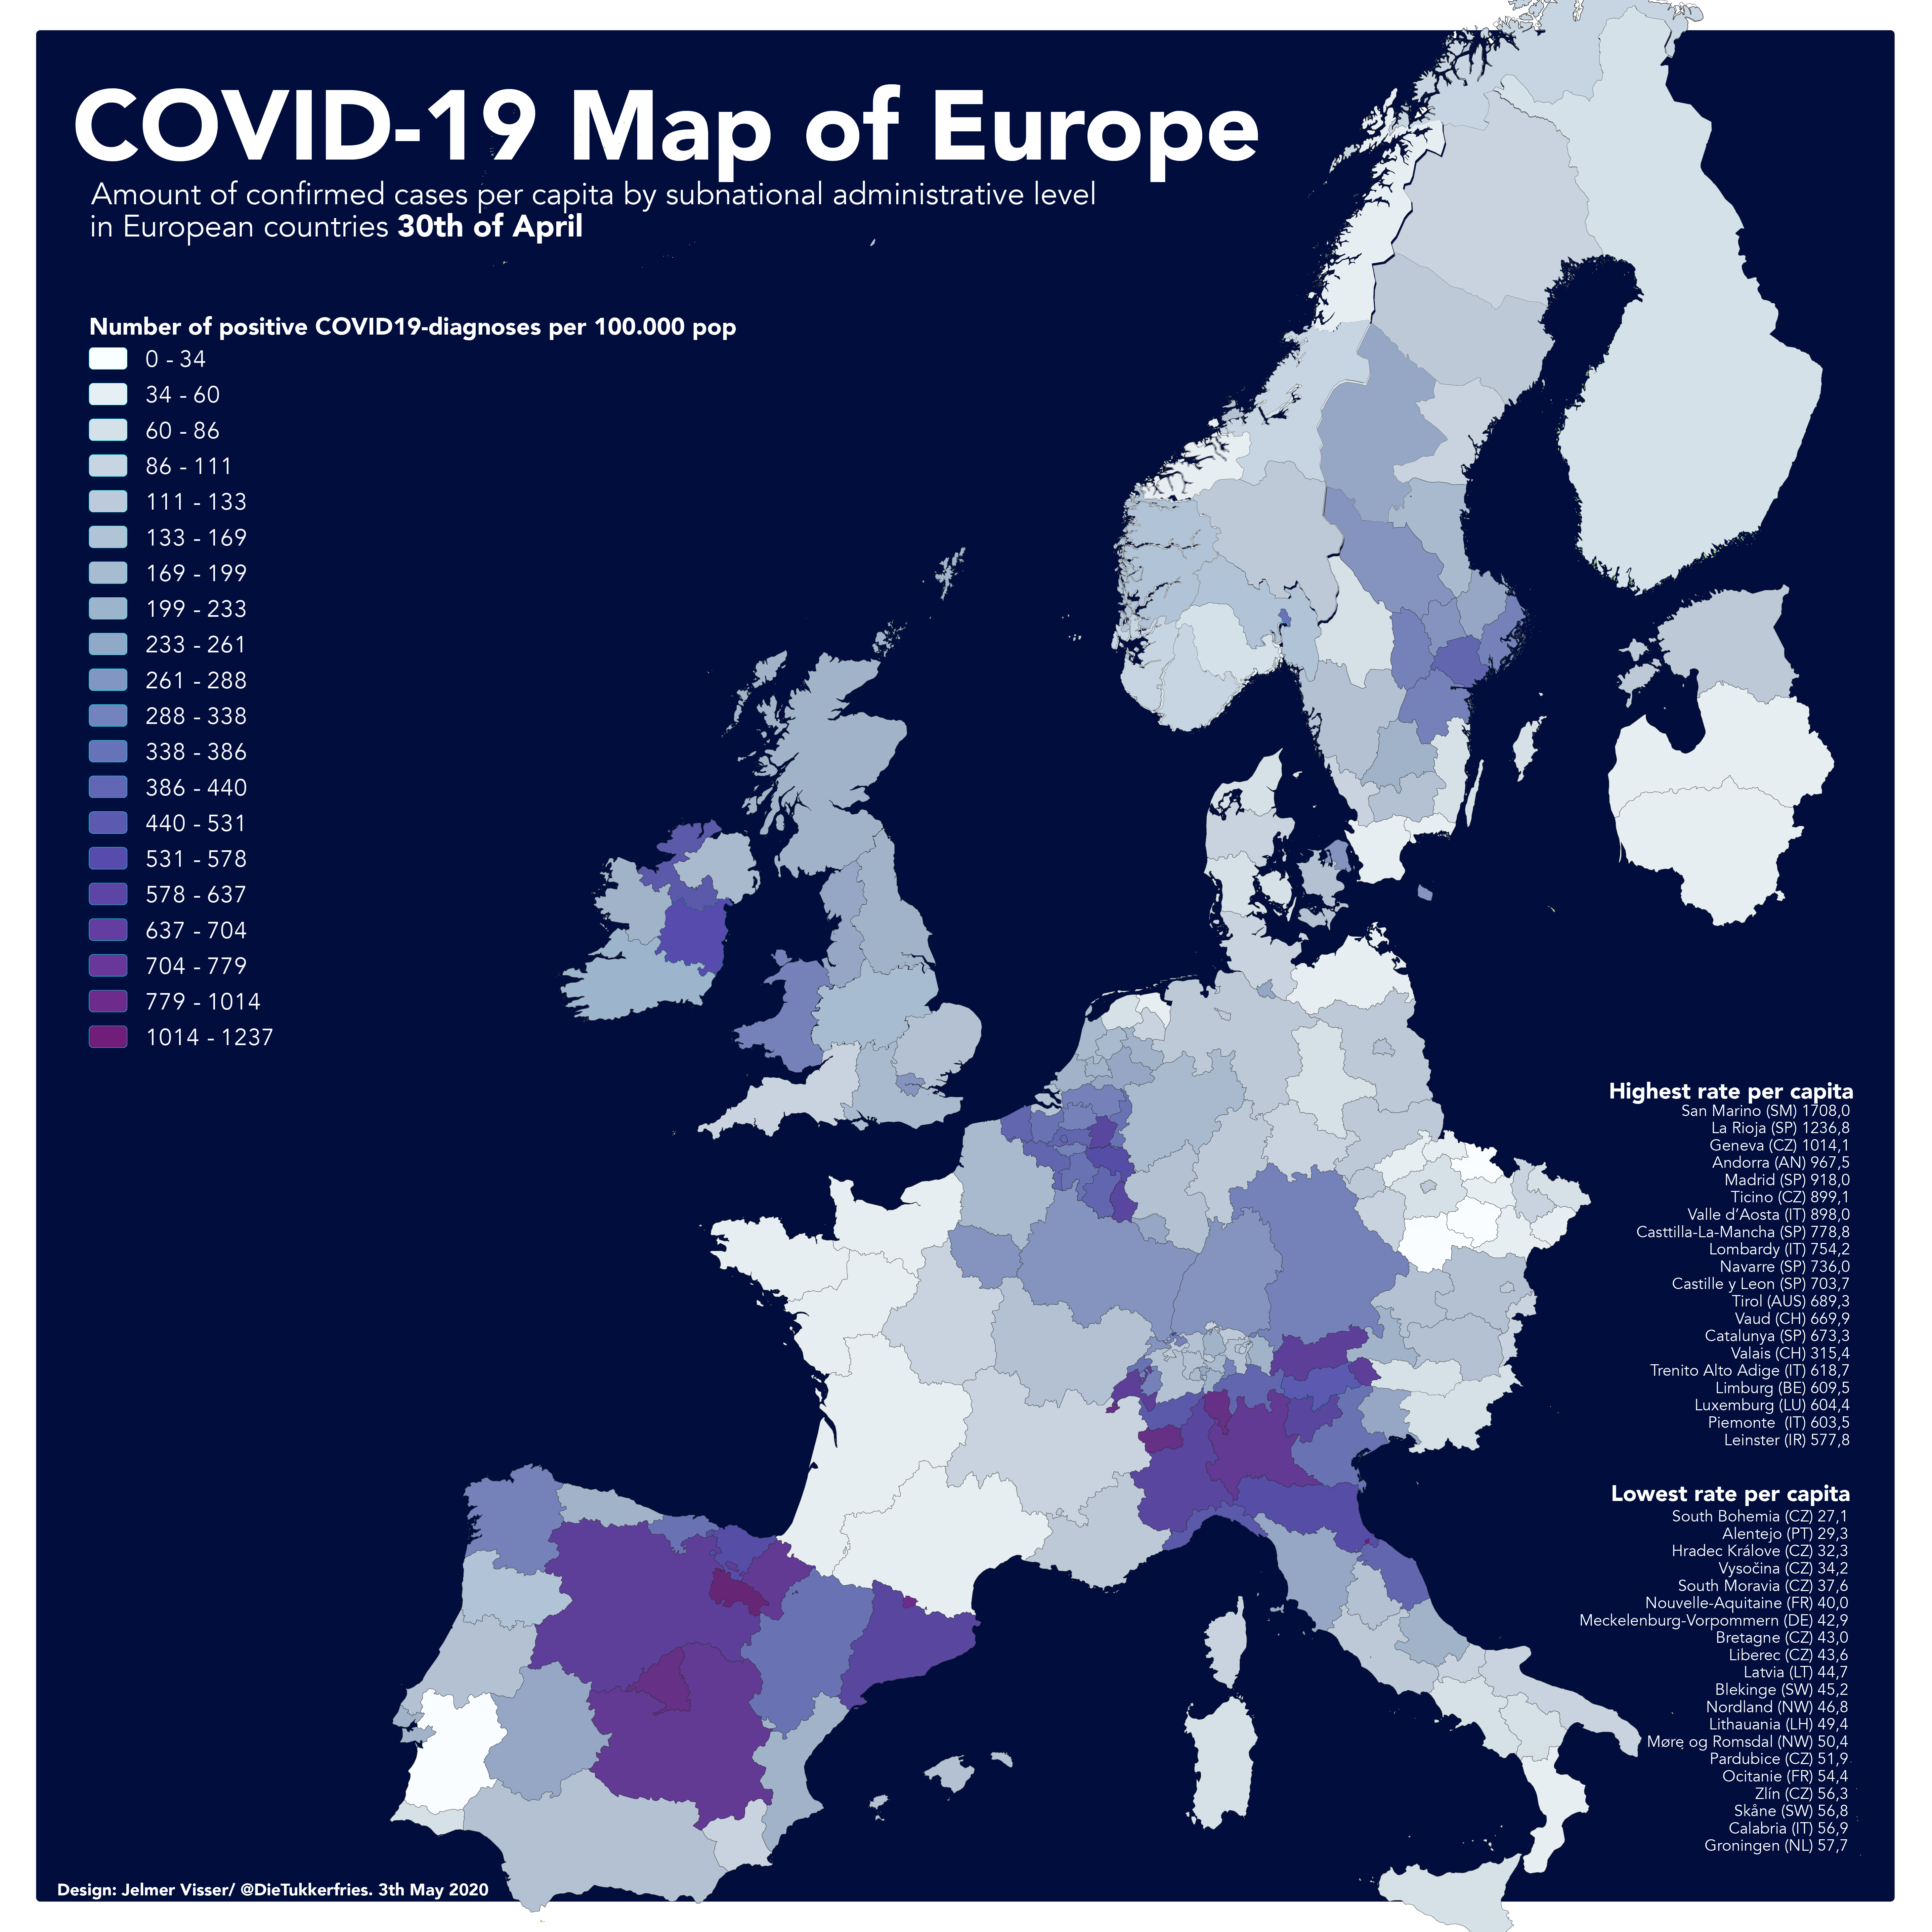
 Diagnosis density levels 30 April
 Number of deaths per 100,000 inhabitants on April 1

Number of deaths per 100,000 inhabitants on April 30
 Number of deaths per 100,000 inhabitants on April 30
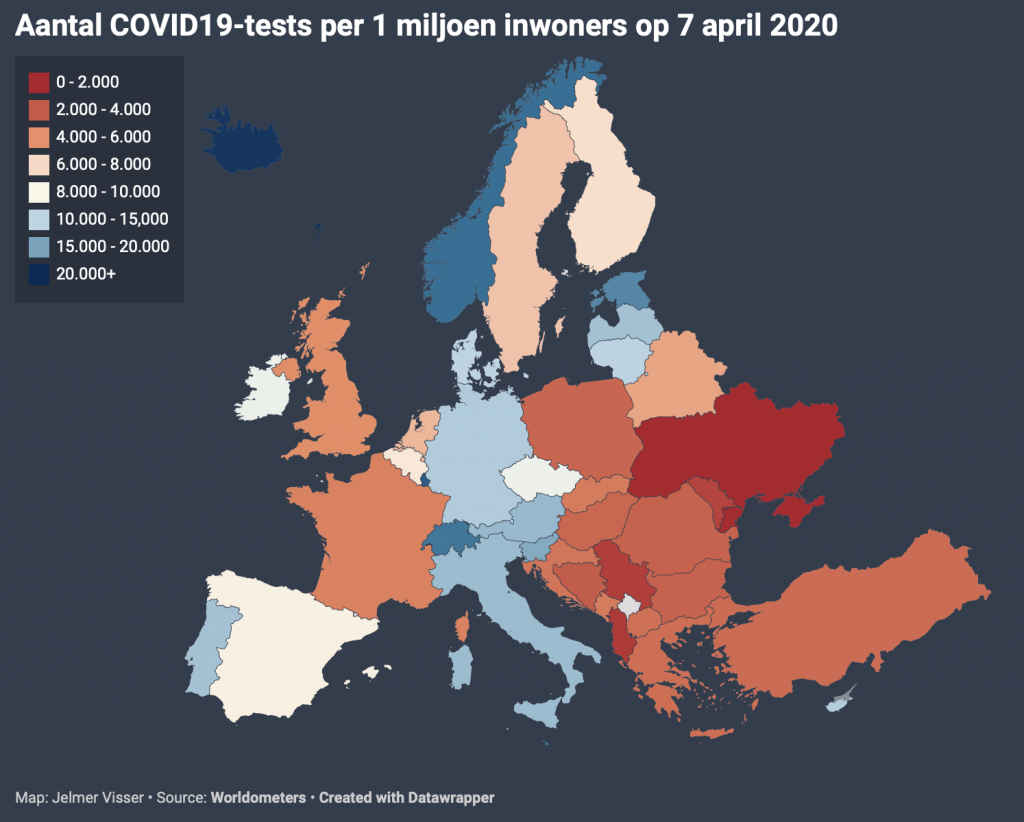
Tests carried out per million inhabitants on April 7
Tests carried out per million inhabitants on May 5

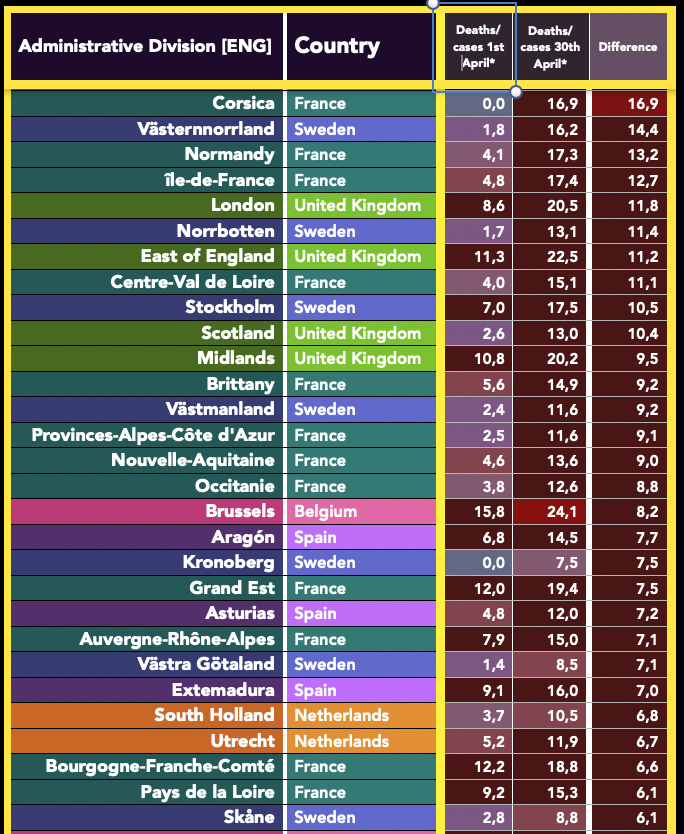
Increased percentage of deaths compared to the number of diagnosed cases in April
Open data
The source data used for the above maps and tables come from government agencies responsible for handling the epidemic per country. Although all of this is public information, it was stored or disclosed in a largely decentralized manner. Consequently, it was quite a challenge to collect the subnational information and include it in one document. But from now on this data is available to everyone.
For a more detailed look at the provincial level or the situation in your region, the complete dataset can be viewed via Google Sheets. Would you like to use the data for your own research or analysis? Then visit Github for a CSV file.

Related Posts


