

Among the many stories, ideas, and new projects that kept our newsroom busy this year is the European Energy Index (EEI). The idea came from the brilliant mind of our former editor in chief Arjan Paans. In one of the last editorial meetings he could attend, Arjan pitched the idea: a real-time tool to check how European countries produce their energy. In times of energy crises and dependencies joining the challenges brought by climate change, the EEI wanted to be a tool to inform, raise awareness, and support policy development.
- This year, we launched the European Energy Index, a real-time map measuring energy production;
- The tool serves to inform but also to support policy development;
- European countries are striving to transition to green power amid a challenging geopolitical scenario.
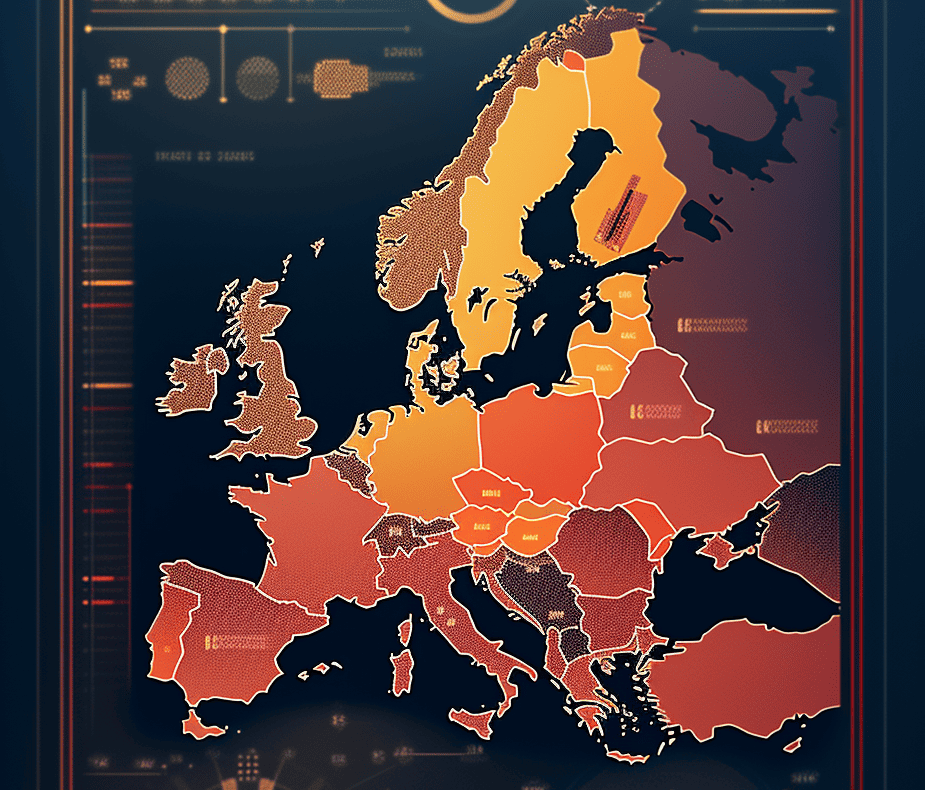
After Arjan passed away, we decided to bring this idea forward—we owed it to him. Then, it was up to Jeroen de Nieuwenhof to create it and Frans van Beveren to produce it. Since late March, our website homepage has featured a map of Europe with real-time data from the European Association for the Cooperation of Transmission System Operators (TSOs) ENTSO-E – for electricity from energy production by country. Brown-flagged countries are likely producing most of their energy from oil, gas, or worse, from coal. Green-colored states are powering themselves more with wind, sun, or hydropower.
Problems and opportunities
Following the start of the war in Ukraine, European countries accelerated reconsidering their energy strategies. Everyone experienced the rise in energy costs following the war outbreak, resulting in a drop in the energy demand to minimize gas imports from Russia. Countries like Italy and Lithuania turned to North America, Africa, or Asia to support their needs. Germany was in the middle of a nuclear phase-out and had to extend the run time of some coal-powered plants.
On the positive side, the conflict gave new impulses to the renewable energy sector; according to the think tank Ember, wind and solar generated 22 percent of the total electricity in Europe in 2022, overtaking gas for the first time. Moreover, nine countries had half of their electricity from renewable sources. It’s worth specifying here that Scandinavian countries have abundant water basins to produce clean power with, something that countries like Belgium or the Netherlands can’t count on.
A signal that climate change is knocking at our door is represented by the recurrent droughts that reduce hydropower output. In 2022, Europe’s hydropower generation was the lowest in two decades. Scientists have already called 2023 “the warmest year on record”.
This is an article from IO Next: The Year Of… For the last magazine of this year, we selected the articles that stuck with us the most, whether it was an impressive interview, an important story or just something funny.
Wind blowing at different speeds
Yet, European countries are installing solar panels and building wind parks – at different speeds. Wind power has become Germany’s primary source of electricity, supplying a quarter of its power. In Denmark, eolic energy is half of power generation; in Spain, it surpassed nuclear generation with over a fifth of energy production. In Portugal, wind turbines were good for around thirty percent of the power generation in 2022.
In France, wind power is a minimal share of the total energy production, dominated by nuclear. In French President Macron’s two-pillar energy strategy, nuclear and wind energy are the two energy sources poised to power France in the decades to come, aiming at forty GW of offshore turbines by 2050. Italy is also lagging amid slow authorization processes and a Mediterranean coast that is less windy than the ocean ones.
Solar
While 2023 was the annus horribilis for solar-powered cars – with the bankruptcy of Lightyear and Sono Motors’ shift to solar panel production – solar energy production was on the rise, and solar panel installations, too. 2022 figures saw Germany, Spain, and Poland leading the chart of newly installed capacity. The Netherlands ranked fourth with four GWs of solar panels capacity installed, driven by the residential rooftop market. Thanks to these new installations, the country ranked first in solar capacity per capita, with more than 1,000 watts per capita. A mid-year report by Ember underlined how solar installations kept the pace up in the first six months of 2023. Germany added 6.5 GW of new capacity, Poland over 2 GW, and Italy 2.5 GW – compared to a three GW total for 2022. Besides, Spain was also expected to accelerate its deployment, adding up to seven GW by the end of the year.
Encouraging records
Given such a solar power expansion, clean power generation is rising across Europe. In May and July, renewable power accounted for over thirty percent of the electricity generation for the first time. A wider renewables deployment – and the match between more of them – has also made it possible to power entire countries with clean power for hours.
While this is normal in Iceland – which gets all of its energy from hydro and geothermal power – it is not in the rest of Europe. On May 23, sun, wind, and water energy covered the whole electricity demand of mainland Spain. Between October 31 and November 6, Portugal ran on renewable power only, supplied by wind and hydroelectric power. In 2022, Greece managed to run on green energy for five hours straight.
In a complicated matter like the energy transition, it will take time and bold choices to make it happen. The shift to clean energy is already happening at different speeds between the various countries and with different strategies. And it will continue doing so, with fossil fuels usage expected to peak by 2025 and plunge after that. As solar cell prices keep decreasing, solar will likely be Europe’s leading renewable energy source, and more developments in the wind sector will follow. You can keep following these developments through the European Energy Index.
Related Posts


