
The Dutch Institute for Applied Scientific Research (TNO) is developing innovative measurement methods to track nitrogen compound emissions, such as ammonia. Researchers are using mobile measurement stations to map nitrogen outputs from livestock sheds, where many such emissions are generated.
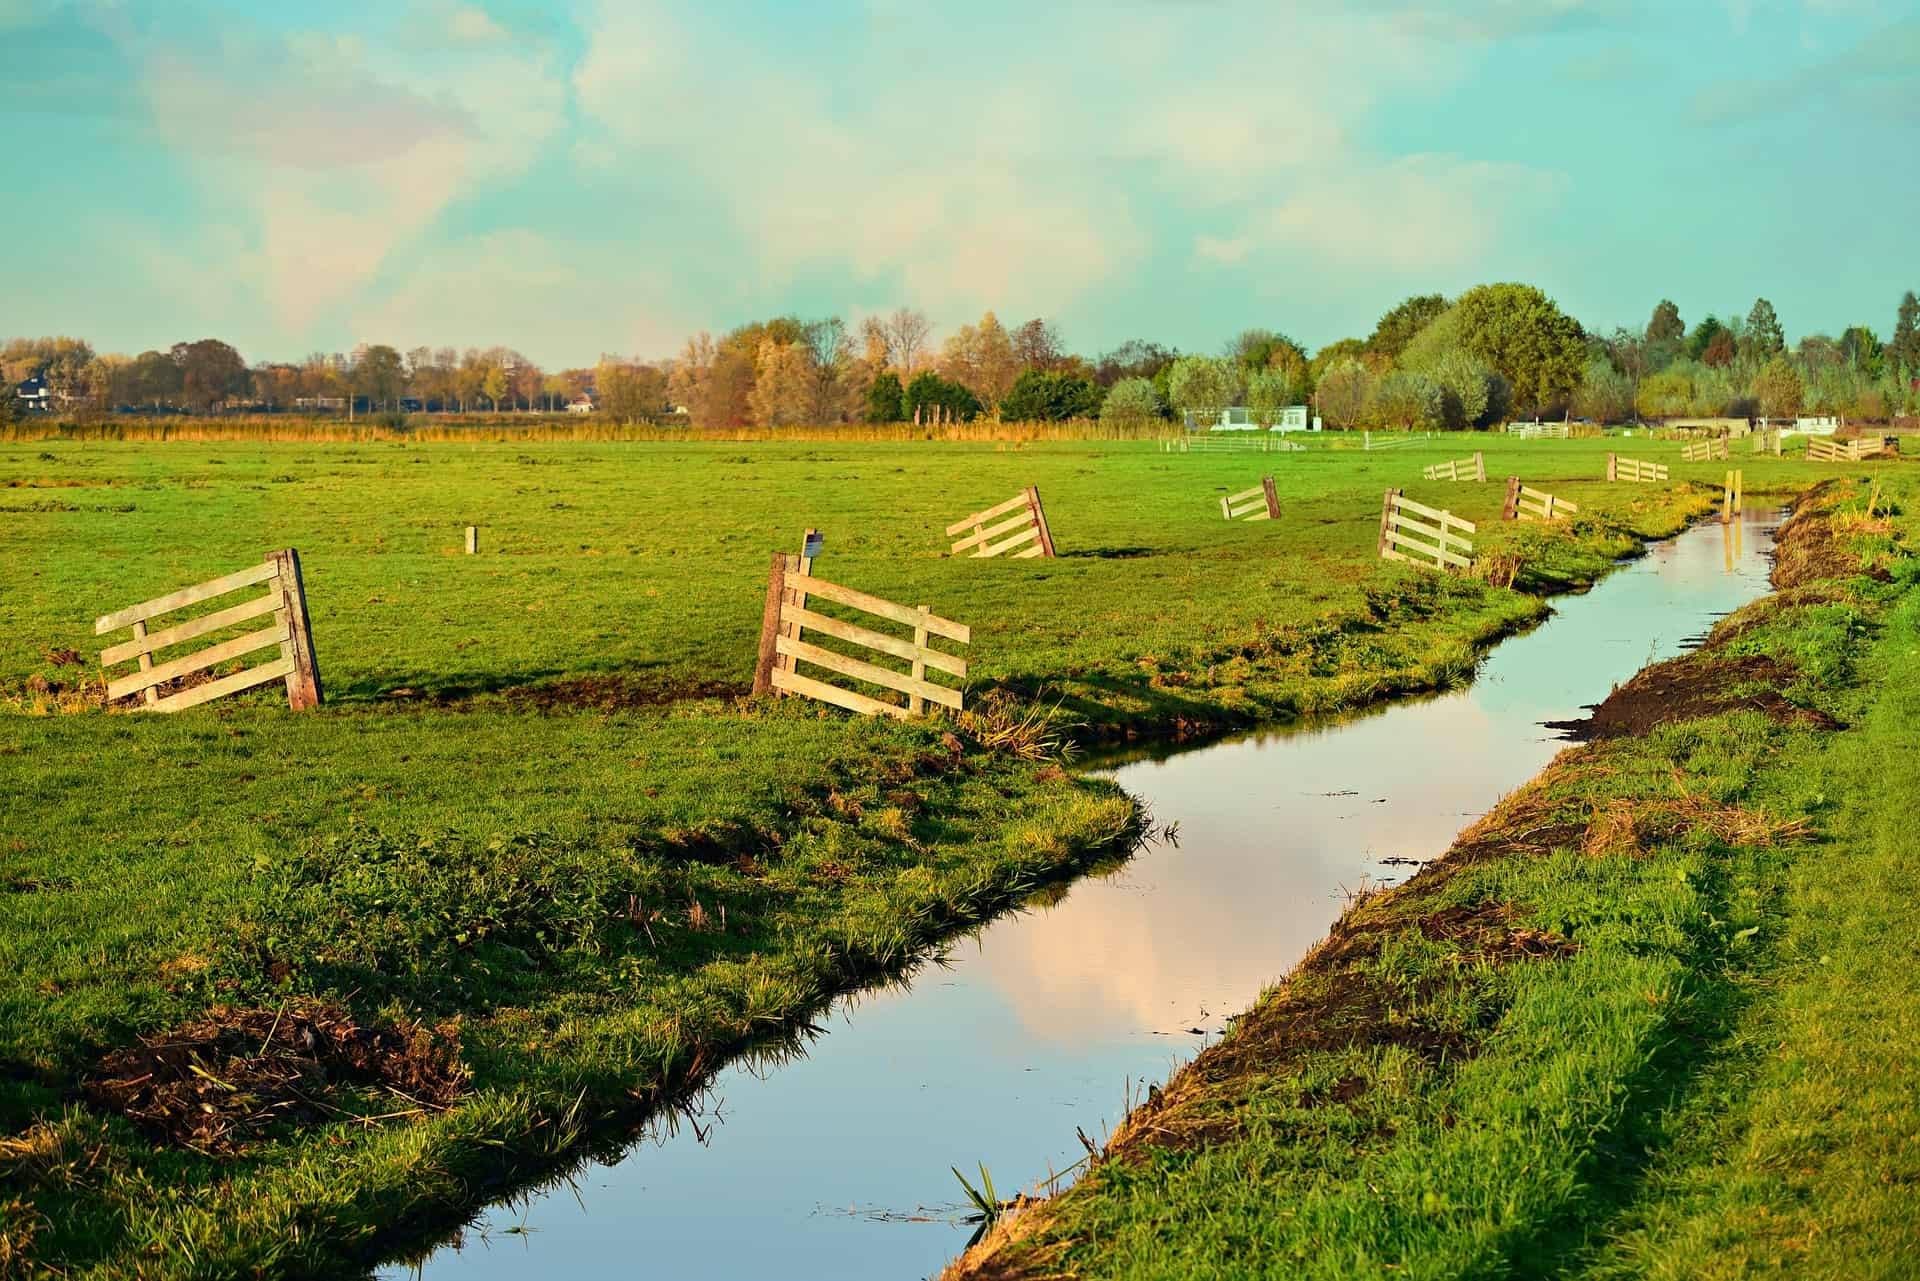
Dutch nitrogen emissions per hectare are the highest in Europe, and ammonia—a nitrogen compound—is harmful to the environment. Ammonia from farms rises into the air as an invisible plume and is then carried by the wind. Yet, much needs to be grasped about how this plume behaves and its distribution.
Therefore, TNO is looking at nitrogen and ammonia emissions with several measurement tools, including mobile ones. “Taking mobile ammonia measurements is more difficult, though, and we had not previously managed to do that. But for two years now we have had an instrument that allows the mobile measurement of ammonia. This is necessary to create a cross-section of that ‘invisible’ ammonia plume”, says Arjan Hensen, Senior Air Quality Researcher at TNO.
Tracking farm emissions
In November 2023, as part of the Ministry of Agriculture, Nature, and Food Quality program, TNO conducted the first major measurement campaign at a dairy farm. This was the first time that ammonia had been measured in this way in Europe, and the height and development of the plume were examined.
Emissions are already measured in cowsheds, but street emissions need to be tracked, too. Developments can also be seen in airborne and space-based measurements. These allow you to quickly make a rough estimate of the emissions from multiple farms on a single day, including contributions from manure storage and treatment, for example. “These figures could then be used to see whether the policy being pursued is actually effective,” says Paula Bronsveld, Climate and Air Quality Manager at TNO.
By repeating these kinds of measurements, the emissions picture at the local level improves, and emission sources can be accurately located. This data type also provides crucial information to improve the data fed into the models used to calculate where ammonia eventually ends up. Bronsveld: “What is measured remains just a snapshot. But it provides a good indication of whether the models are correct, and you can use it to detect peak emissions.”
Next steps
The next step is to compare all the concentration data with a 3D model of the plume. This will allow us to see whether the calculated height, width, and concentrations in the plume tally with the measured values. “We will also then be able to determine how well the characteristics of the plume, and therefore the farm’s emissions, can be predicted from the mobile measurements,” Bronsveld explains.
Related Posts


