
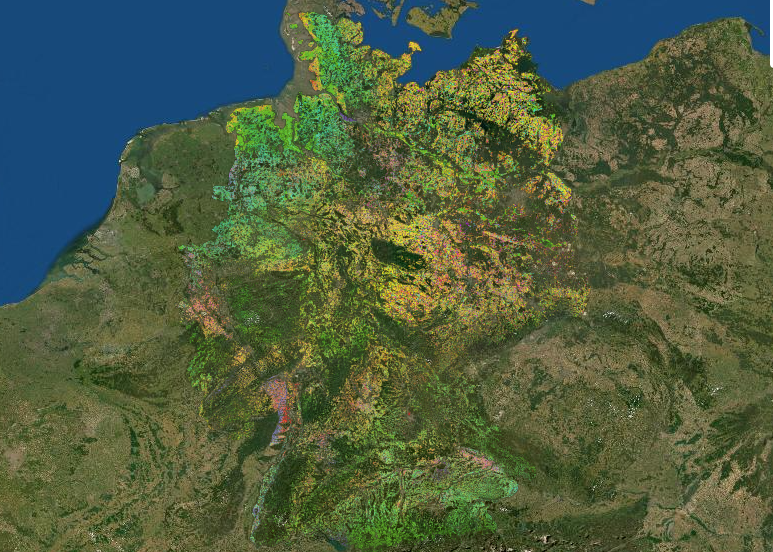
Information about what was grown on which agricultural land in which year would often be helpful in environmental and agricultural policy to answer important questions. But so far, this information has not been available in Germany. Only general statistics on land use were reported which provided only fairly rudimentary information and did so with a time lag. Yet images from weekly satellites could provide much more precise information in this area and at the same time serve as a database for a detailed land use map. Researchers from the Thünen Institute, the Humboldt University of Berlin and the Leibniz Center for Agricultural Landscape Research (ZALF) e.V. in Germany have now jointly produced precisely such a map for the first time. They used remote sensing data to produce maps of agricultural land use for 2017, 2018 and 2019.
To do this, they applied machine learning methods as well as available information from farmers on previous land use. Data from the U.S. Landsat 8 Satellite Mission and the Copernicus Program of the European Space Agency (ESA) were also used. In addition, weather data from the German Weather Service were taken into account, as well as the Germany-wide elevation model and the digital landscape model of the Federal Agency for Cartography and Geodesy (BKG). Using all these data and images, the scientists were finally able to depict regional characteristics as well as seasonal and annual variations.
Precise recording of crop types and landscape elements
The maps distinguish between the dominant crop types and main land uses in arable land. They show all the main grains, root crops, vegetables, permanent crops and legumes. But the information on the maps even goes one step further by showing relevant landscape elements such as woody structures. Thanks to these new maps, for the first time a comprehensive picture of Germany’s agricultural landscape exists, in a 10 m x 10 m grid. And this is not the end of the story.

“Although the maps already show a high degree of accuracy, there is still a need for further research,” says Prof. Patrick Hostert of Humboldt University in Berlin. For example, crop types such as rapeseed or sugar beet can be differentiated very well, but there is still a lot of catching up to do in the case of species that are very similar in terms of their growth phases or appearance, such as winter wheat and triticale. Likewise, species such as silage maize and grain maize, which differ only in terms of their type of use, cannot yet be mapped with sufficient accuracy.
Further research needed
According to the researchers, there is also a need for further research, for instance, at sites that flood repeatedly. But despite these current shortcomings, the maps are “a milestone in the development of area-wide information on agricultural use,” the Thünen Institute scientists emphasize. They plan to continuously improve the maps in the future.
“The wide range of applications for other ongoing projects demonstrates that these maps are not an end in themselves,” says Dr. Stefan Erasmi, head of Thünen’s remote sensing unit. In addition to supplementing and refining agricultural statistics, they can provide a basis for monitoring activities at the national level. As an example, the researchers cite biodiversity assessment, EU Common Agricultural Policy (CAP) measures and a change in land use as a factor in greenhouse gas reporting. “The maps are also essential input parameters for simulations of agricultural yields and ecosystem services,” said Prof. Claas Nendel of ZALF.
Also of interest:
This is how much microplastics pollute agricultural soils
European Union lays the groundwork for sustainable agriculture
DLR tests digitization in agriculture (German only)