

Nitrogen oxides (NO and NO2) are emitted primarily during combustion processes which involve coal, oil, gas, wood, waste and engines. But they are also generated during industrial processes and in agriculture. Pinpointing pollution sources and then measuring substance emissions such as nitrogen oxides can pose major problems for cities and municipalities. But this is exactly what is needed in order to be able to predict air pollution from nitrogen oxides and develop strategies for their reduction. Moreover, according to national and international conventions such as the Kyoto Protocol, countries must specify how high their greenhouse gas and air pollution levels are. The data is documented in what are known as emission inventories.

Tropospheric Monitoring Instrument
Yet daily satellite measurements, which have so far been one of the methods used, do not provide accurate results. This is because the instrument tracks a specific area and registers all pollutants between the ground and the satellite. These values often vary widely and are therefore usually recorded over a period of several months. Scientists from the Max Planck Institute for Chemistry in Mainz explain that emission values determined from space tend to “blur” as a result of fluctuating winds. This in turn reduces the spatial resolution of the measurements.
In collaboration with colleagues from China and the USA, research scientists have now found a way to vastly improve the spatial resolution of nitrogen oxide emission data. They do this with help from the European Space Agency’s (ESA) recently launched S5P/TROPOMI research satellite. TROPOMI stands for Tropospheric Monitoring Instrument. In addition to nitrogen oxides, the spectrometer also measures other pollutants and greenhouse gases. These include carbon monoxide, formaldehyde, ozone and methane. The spectrometer has been flying around the Earth on board ESA’s Sentinel-5 Precursor (S-5P) satellite since October 2017.
More articles on air pollution can be found here.
Local analysis to within two kilometers
Thanks to these values provided by TROPOMI, scientists are able to determine the exact amounts of pollutants emitted more accurately. The team combined measurements from the satellite with wind data. They were thereby able to ascertain the levels of underlying emissions from the horizontal transport of the pollution. TROPOMI is also able to reconstruct the blurred data.

“Our method enables us to pinpoint specific emission sources, such as individual coal-fired power plants, with an accuracy of up to two kilometers separate from any surrounding pollution,” says Steffen Beirle. He is the first author of the study published in the current issue of the research journal Science Advances. Furthermore, “the levels of pollutants emitted can also be quantified more reliably. Plus, emission inventories can be examined for their topicality and spatial distribution.”
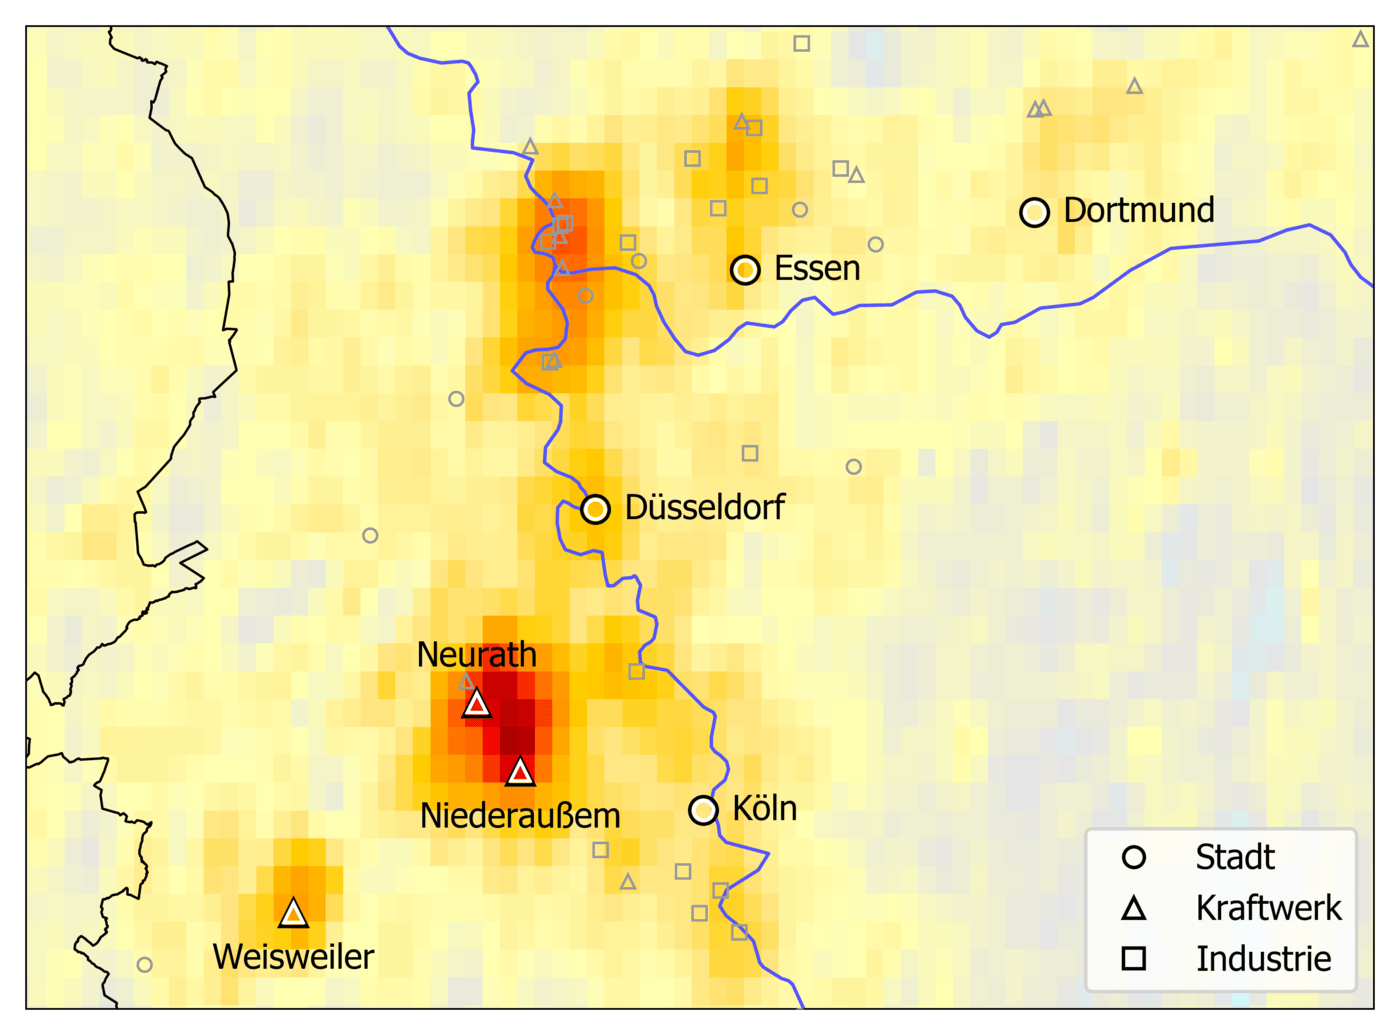
The scientists maintain that emission patterns facilitate clear identification of specific sources and distinguish power plants from other sources such as traffic. It was possible to create a detailed emission pattern with the help of this new method for the area around the Saudi Arabian capital Riyadh. Among other things, it revealed the pollution emissions from various oil and gas power plants in the vicinity. After the researchers had also prepared these types of emission patterns for Germany and South Africa, it also became clear that coal-fired power plants are the largest single sources of nitrogen oxides in those areas.
Cover photo: Nitrogen oxide emissions in Northern Rhineland. Evaluation of median satellite data (April to October 2018) using the new method clearly separates the Niederaussem and Neurath coal-fired power plant emissions from those of the cities Cologne and Düsseldorf. Source: MPIC, S. Beirle
Related Posts


