


Since November 2, 2020, Germany has been in a four-week “lockdown light”. Will these measures be enough to reduce the number of people infected with the SARS-CoV-2 virus? Scientists at the Forschungszentrum Jülich (Research Center Jülich), in cooperation with the Frankfurt Institute for Advanced Studies (FIAS), have now simulated various scenarios using mathematical models that had already been developed for predictions during the first COVID -9 wave. In these simulations, the researchers show how many new coronavirus infections are to be expected daily in each scenario and how many intensive care beds would consequently be needed to care for patients.
A November lockdown is not enough if … …
…… all measures of this “lockdown” are then lifted. A third COVID-19 wave in winter would not be able to be prevented in this case. And this third wave would be even more severe than the previous ones. On the other hand, one or two additional two-week lockdown periods in winter and spring could act as ‘circuit-breakers’ so that “basic levels of everyday activities could continue, and keep the COVID-19 wave(s) under control,” the scientists explain.
However, the simulations also show that “permanent, less restrictive measures, such as those that existed in many places before the ‘lockdown light’,” could possibly also help to contain the epidemic in Germany over the long term. Even without temporary lockdown periods.
“Our long-term scenario models are to be understood in a qualitative sense and do not claim to predict the real course of events precisely,” says Dr. Jan Fuhrmann from the Simulation Lab Epidemiology and Pandemic of the Jülich Supercomputing Centre (JSC). “However, the scenarios do show very well how the epidemic could develop if different measures are taken. We emphasize that the sometimes very high case numbers predicted in the simulations will only occur if appropriate additional measures that are necessary to contain the epidemic aren’t actually taken. These would be, for example, limited local lockdown periods, which had not been taken into account in the scenarios up until now.” Jan Fuhrmann has calculated the progression of the corona epidemic in collaboration with Dr. Maria Barbarossa of the Frankfurt Institute for Advanced Studies (FIAS).
Scenario 1: 4-week lockdown in November, no further measures thereafter

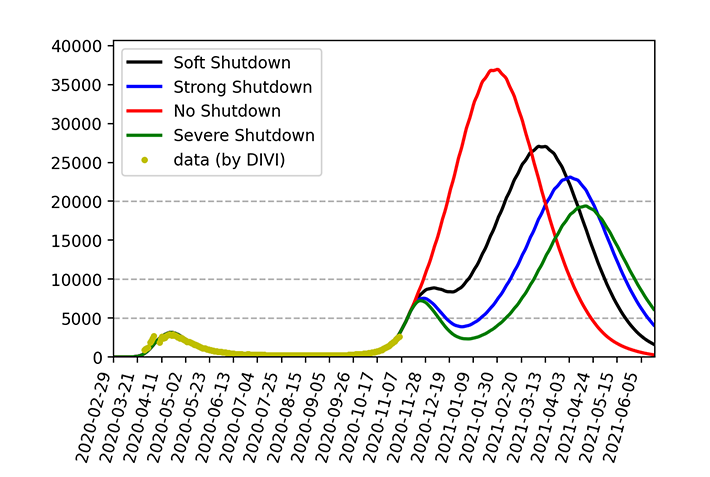
Without a lockdown in November, there would be more than 100,000 new infections in January on a seven-day average and as many as 35,000 intensive care beds would be needed at times. A four-week shutdown in November alone would not be enough to prevent a temporary surge in intensive care patients to over 20,000 in February/March 2021. The figures are not expected to subside until the end of May 2021.
Scenario 2: 4-week lockdown in November, followed by an additional 2-week shutdown


After March 2021, the number of new infections would reach a new peak. However, the figures would be lower than in scenario 1, with a maximum of up to 40,000 to 50,000 infections per day. The number of intensive care beds expected to be needed might be reduced to below 20,000. In this scenario, the figures are also expected to decline from the end of May onwards.
Scenario 3: 4-week lockdown in November, followed by two further 2-week shutdowns


In this scenario – three “soft shutdowns” – the peak is expected in February. When combined with “strong shutdowns,” that would occur earlier and likely with less than 40,000 new infections per day. In some combinations, the number of intensive care beds would even fall below 10,000, according to the researchers.
Soft, strong or severe shutdowns
The difference between ‘soft, strong, or severe shutdowns’ refers to the number of contacts, as in the ‘number of one-on-one contacts amongst the population per time frame,’ and not to concrete measures that are actually implemented.
Soft Shutdown: A reduction of the contact rate to about 35% of the value achieved in late summer, when the case numbers were still low.
Strong Shutdown: A reduction of the contact rate to about 25% of the value achieved in late summer (corresponds to the contact reduction as called for in a statement issued by the Helmholtz Research Centers and other affiliated research institutes).
Severe Shutdown: A reduction of the contact rate to about 15% of the value achieved in late summer.
No Shutdown: A so-called baseline reduction of the contact rate to about 60% of the value reached in late summer. This value is also ascribed to times outside the shutdown periods described above.
Impact of the current ‘Lockdown Light‘
The researchers classify the effects of the “Lockdown Light” as somewhere between a “Soft Shutdown” and a “Strong Shutdown”. In principle, it is very difficult to predict the effect of individual measures. “Therefore, we only provide scenarios based on the assumption of different degrees of contact reduction. In particular, the behavior of the general public is difficult to gauge given the available figures and governmental guidelines.”
Szenario 4: Permanent measures, with and without periodic lockdowns


The maximum number of new infections per day in this scenario would be about 20,000. The number of occupied beds in the intensive care unit would most likely be less than 10,000.
Original publications on the development of the models during the first COVID-19 wave:
Fuhrmann, J., Barbarossa, M.V.: The significance of case detection ratios for predictions on the outcome of an epidemic – a message from mathematical modelers. Arch Public Health 78, 63 (2020). https://doi.org/10.1186/s13690-020-00445-8
Modeling the spread of COVID-19 in Germany: Early assessment and possible scenarios. MV Barbarossa, J Fuhrmann, J Meinke, S Krieg, HV Varma, N Castelletti, and Th Lippert. PLOS ONE 15(9): e0238559 (2020), https://doi.org/10.1371/journal.pone.0238559
Diagrams © Forschungszentrum Jülich
Related Posts


