

Which Dutch city centers suffer the most from heat islands on hot summer days? This series tries to find an answer to this question with the help of the ECOSTRESS data provided by NASA, where ground temperature data in areas measuring 70 by 70 meters can be sought. For several months, these super-local measurements are also available for the Netherlands. A new episode is published every Tuesday and Friday, which features three new city maps. Read the other episodes of this series here.
Although it has now cooled down considerably outside, this summer series is still scorching hot. After six installments, quite a collection of maps of Dutch inner cities has been built up, showing exactly where it heats up the most on a hot summer day.
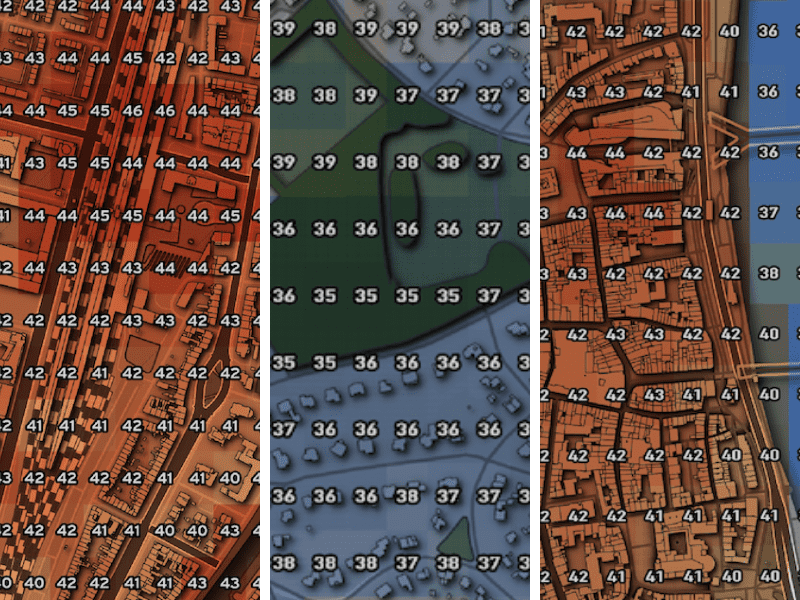
These maps were created using ECOSTRESS data from a NASA satellite during the summer weekend of Aug. 12 and 13, when it got above 30 degrees almost everywhere in the Netherlands. Because the data are displayed via this method in 70-by-70-meter blocks, this immediately shows heat islands at the hyperlocal level where significant differences appear between them.

In this episode, three additional cities are introduced: ‘s-Hertogenbosch, Amersfoort, and Maastricht. Air conditioning or oven? That’s what we’ll find out in the seventh part of this series. Note: this is an algorithm’s estimate of the ground temperature, which by definition is higher than the air temperature we know from weather maps, measured at 150 centimeters above the grassy ground. Also, as a rule, business parks and furniture boulevards warm up more strongly than city parks and residential areas.
‘s-Hertogenbosch

Compared to many other cities, the inner city and most residential areas keep heat stress reasonably under control. Ground temperatures above 45 degrees are limited to a few small areas around the train station. The old city center is even on the cool side by Dutch standards. A relatively modest heat island can be spotted just west of Market Square. And although there are no really high peaks here, cooling is best found in the extreme south at Bastion Oranje.
Still, this does not mean that it is not warming up anywhere at all in Den Bosch. Furthermore, it is noticeable that the neighborhoods north of the inner city remain several degrees cooler than those to the east and west. The Helftheuvel district shows a peak of 48. But this is still nothing compared to the slightly more northern business complexes. Temperatures above 50 are seen between the containers of the industrial port and the roof of H&B Logistics. Around the Heineken brewery, the area heats up the most with 50.5°C, a very high value that is more than enough for a spot in the heat island top ten at the end of this story.
Amersfoort

Because of its colors, the heat island map of the second city of the province of Utrecht is a rather strange one. How this can be? It’s clear: vast residential neighborhoods are surrounded by trees, lots of trees. The western Bergkwartier, in particular, seems to suffer relatively little from the summer heat. It has not occurred so far in this column that such a large area remained below forty degrees. Everywhere southwest of the station, the temperatures remain well below forty. Liendert, Rustenberg and Schothorst are also warming up considerably less than many other residential areas.
Is Amersfoort the best kid in the class? Almost, it seems. Because even in the inner city, temperatures are not too bad, according to Ecostress data. The Lieve Vrouwekerkhof gets a few degrees warmer than the rest of downtown, as does the Arnhemseweg. Finally, the Amersfoort map shows how the situation can differ between residential areas. Immediately south and northwest of the center, where the buildings are also denser, it warms up on average about five degrees more than the Bergkwartier from the previous paragraph. But then again, this is the most prominent oasis of coolness that occurred in all of the 20-plus cities.
Maastricht

Amersfoort heat-stress champion? Not the city center at any rate. For this, we have to go to the extreme south of the Netherlands. The summer heat seems to have very little grip on the streets of downtown Maastricht. Even the modest heat islands of 45 °C that we still saw in the previous two cities do not occur here. None of the centers we have seen so far have been as cool as the capital of Limburg, which is located in the normally hotter areas of the country.
Is this the result of the cooling of the Meuse River, space for greenery, or a proactive heat island policy by the municipality? We can’t tell, but look forward to any local comments. Together with Amersfoort, Maastricht can call itself the ‘best kid in the class’ regarding heat islands around the city center. The only flaw on this neat heat island map is the event hall MECC in the southwest, where the roof heats up to a blood-hot 50.1 °C. Given that the rest of the city remains so chilly, this is pretty out of place.
Still, this does not take away from the fact that many municipalities dealing with this issue should consider visiting South Limburg. If they find this too far away, Amersfoort is an excellent alternative.
Hot rankings
The top ten hottest venues in the Netherlands of this series gets three new spots after this seventh episode: ‘s-Hertogenbosch comes in at places seven and eight, while MECC Maastricht takes the new ninth spot. As a result, Groningen’s Sontplein, Rotterdam’s Kleinpolderplein, and Schiedam’s Rotterdam Dijk disappear from the rankings. After this installment, this looks as follows, with the roof of Utrecht’s Jaarbeurshallen complex still the undisputed list leader.
Finally, this section introduces a second ranking in which all cities mapped so far are ranked by the highest ground temperature in the city center. The second column does not distinguish between the city center and the rest of the map. To put everything in a better perspective, the right column lists the air temperatures for Aug. 12/13. With the help of this list, it quickly becomes apparent that the problem cases did not occur in this episode.
Related Posts


