
The first dashboard in the Netherlands that will predict, with great certainty, where local outbreaks of COVID-19 infections may occur, receives a half million-euro grant from ZonMW. A multidisciplinary research team led by Nelly Litvak, Professor of Algorithms for Complex Networks at the Eindhoven University of Technology (TU/e), will be using this dashboard. The team has worked to provide such predictions since the corona outbreak in March, using aggregated mobility information from cell phone usage.
The grant will be used to further improve those predictions, by combining their own data with data from the COVID Radar App. This will enable safety regions, responsible for local and regional corona measures, to intervene faster and more effectively in the event of imminent corona outbreaks and can even prevent the emergence of new hotbeds.

Project leader Nelly Litvak. © Rob Stork
The new dashboard can make a difference in the speed of detection, says project leader Nelly Litvak. “By combining the aggregated mobility patterns with the risky behavior data in the mathematical model of the virus’s spread, we can determine the risks of it spreading from one area to another fairly accurately. This may allow authorities to detect a potential local wave of infections and take timely measures – something which is very important now that the virus seems to be taking hold again.”
The safety regions of Groningen and Twente have already promised to provide the team with feedback right from the start so that the first prototypes can be designed to optimize the user experience from the beginning.
Radar app
The basis for identifying the infections is the COVID Radar app, developed by Leiden University Medical Center (LUMC) and in use since April of this year. With more than 3,5 million completed questionnaires by over 215,000 unique users, this app provides local insights into infectious concentrations. The data is anonymized and thus suitable to be shared for information analysis.

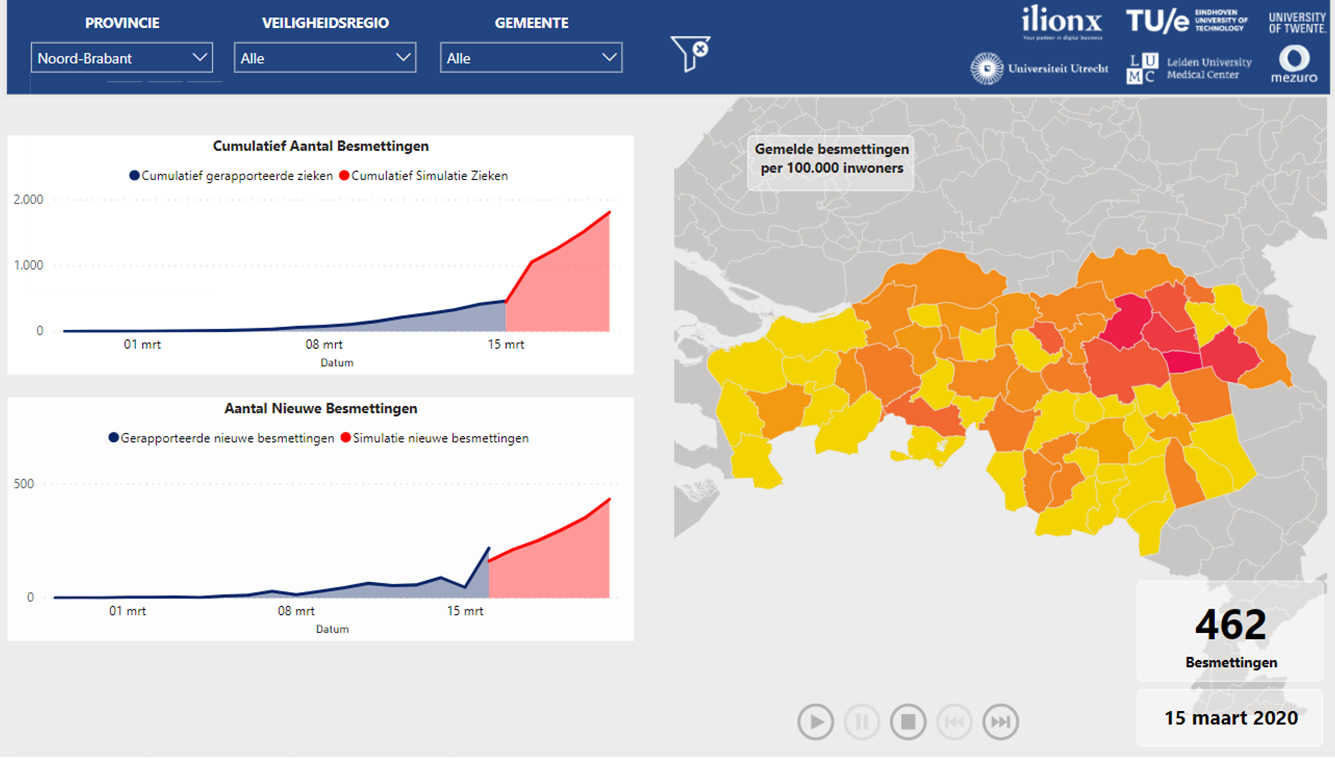
Extra value is coming from the anonymized and aggregated mobility data from the Mezuro, which gathers data around residential locations, travel destinations, duration of travel, and the. mode of transportation. The combined data will be the input for IT service provider ilionx, which subsequently visualizes the regional risks in an easy-to-read dashboard.
Dashboard
The team of TU/e, Mezuro, ilionx, and Utrecht University started their research to predict regional COVID-19 outbreaks based on telephone data in March. After combining it with the COVID Radar app, they were able to deliver a first prototype in April. The first test version of the dashboard is expected to be ready in three months’ time. During the course of the research, which will take a total of 1.5 years, this dashboard will be further optimized for use by policymakers of safety regions or health authorities.
Related Posts


